Featured
Documentation
Mastering Mermaid Diagrams for Software Development
A comprehensive guide to using Mermaid diagrams for software development - from sequence diagrams to class diagrams, component diagrams, and more. Learn how to create powerful visual documentation with simple text-based syntax.
Nilushan Silva
25 min read
In This Article
Use the headings in the article to navigate
Tags
mermaid
diagrams
documentation
software design
DevOps
architecture
Mermaid is a powerful JavaScript-based diagramming and charting tool that lets you create diagrams using text and code. It’s particularly valuable for software developers because diagrams can be version-controlled, reviewed, and maintained alongside your code.
In this post, I’ll explore the different types of Mermaid diagrams that are most useful for software development, with practical examples you can use immediately.
Why Mermaid?
Before diving into the diagram types, here’s why I love Mermaid:
- Text-based: Store diagrams in version control with your code
- Easy to maintain: Update diagrams by editing text, not dragging boxes
- GitHub-native: Renders automatically in GitHub README files and issues
- No special tools: Works in Markdown, documentation sites, and many IDEs
- Consistent styling: Automatic layout and theming
1. Sequence Diagrams
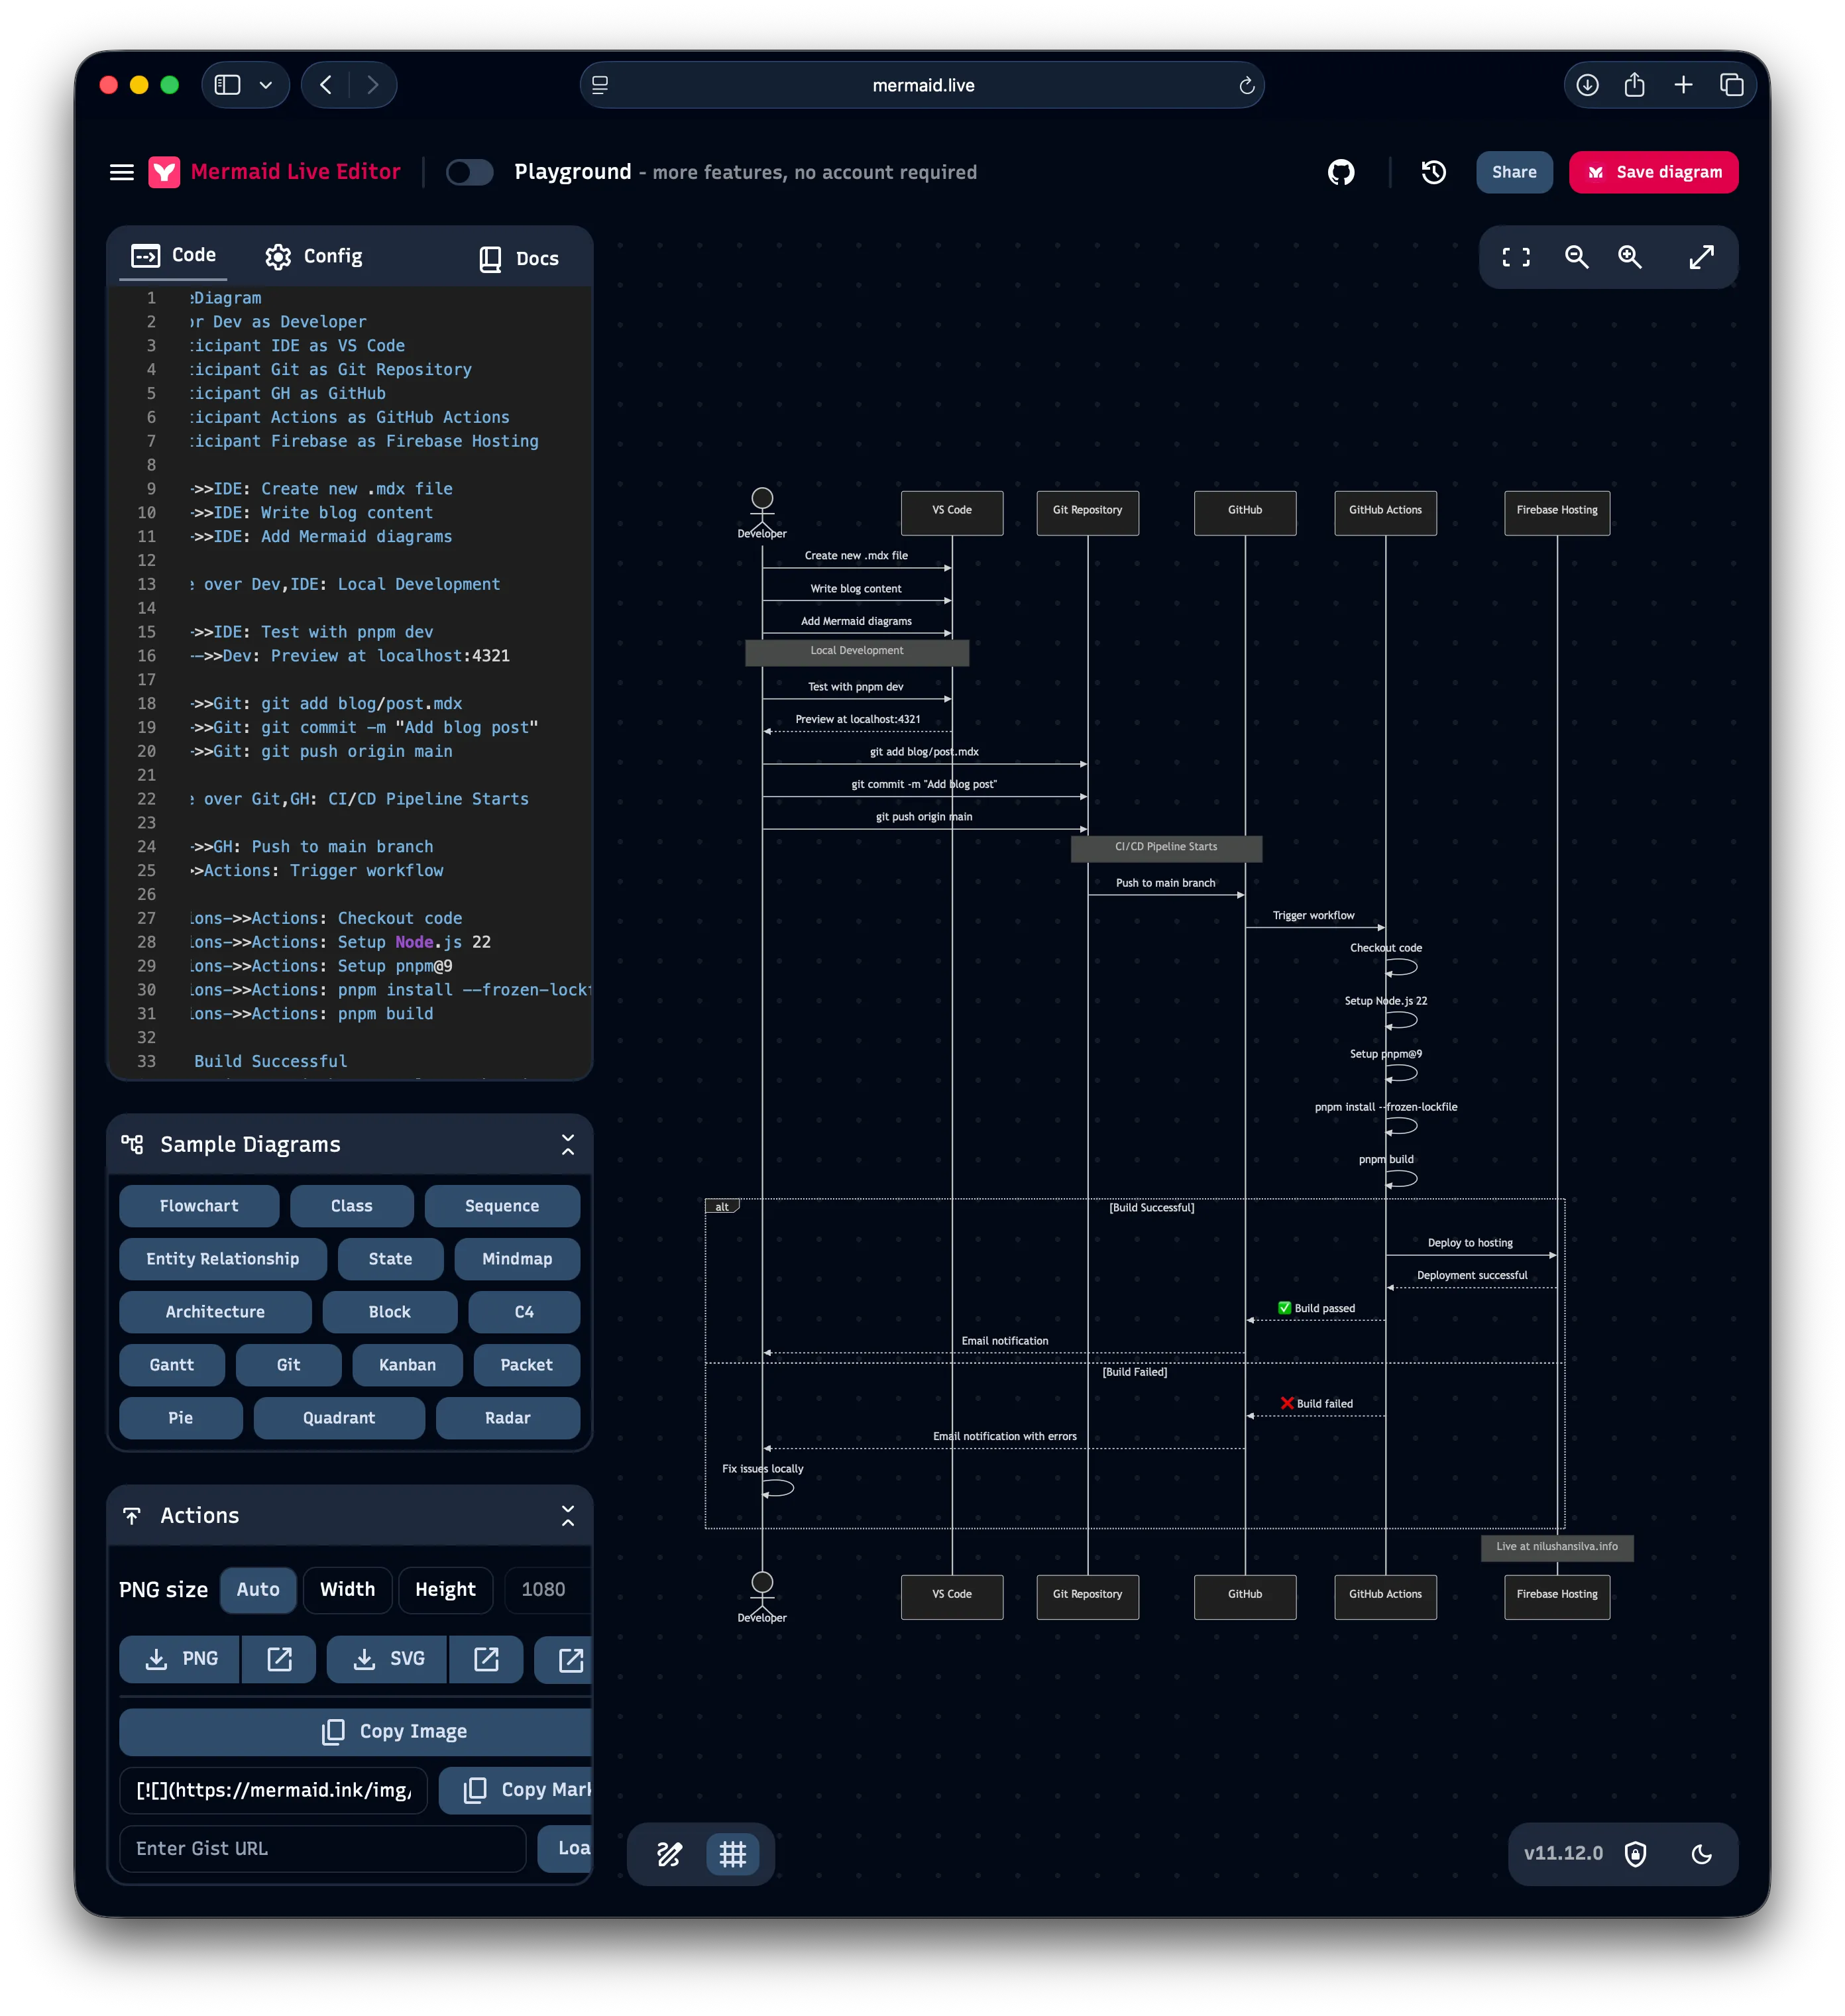
Sequence diagrams are perfect for visualizing interactions over time. Let’s model the process of creating and deploying a blog post in this very portfolio project.
Creating and Deploying a Blog Post
Rendered Diagram:
sequenceDiagram
    actor Dev as Developer
    participant IDE as VS Code
    participant Git as Git Repository
    participant GH as GitHub
    participant Actions as GitHub Actions
    participant Firebase as Firebase Hosting

    Dev->>IDE: Create new .mdx file
    Dev->>IDE: Write blog content
    Dev->>IDE: Add Mermaid diagrams

    Note over Dev,IDE: Local Development

    Dev->>IDE: Test with pnpm dev
    IDE-->>Dev: Preview at localhost:4321

    Dev->>Git: git add blog/post.mdx
    Dev->>Git: git commit -m "Add blog post"
    Dev->>Git: git push origin main

    Note over Git,GH: CI/CD Pipeline Starts

    Git->>GH: Push to main branch
    GH->>Actions: Trigger workflow

    Actions->>Actions: Checkout code
    Actions->>Actions: Setup Node.js 22
    Actions->>Actions: Setup pnpm@9
    Actions->>Actions: pnpm install --frozen-lockfile
    Actions->>Actions: pnpm build

    alt Build Successful
        Actions->>Firebase: Deploy to hosting
        Firebase-->>Actions: Deployment successful
        Actions-->>GH: ✅ Build passed
        GH-->>Dev: Email notification
    else Build Failed
        Actions-->>GH: ❌ Build failed
        GH-->>Dev: Email notification with errors
        Dev->>Dev: Fix issues locally
    end

    Note over Firebase: Live at nilushansilva.info
View Mermaid Code
```mermaid
sequenceDiagram
    actor Dev as Developer
    participant IDE as VS Code
    participant Git as Git Repository
    participant GH as GitHub
    participant Actions as GitHub Actions
    participant Firebase as Firebase Hosting

    Dev->>IDE: Create new .mdx file
    Dev->>IDE: Write blog content
    Dev->>IDE: Add Mermaid diagrams

    Note over Dev,IDE: Local Development

    Dev->>IDE: Test with pnpm dev
    IDE-->>Dev: Preview at localhost:4321

    Dev->>Git: git add blog/post.mdx
    Dev->>Git: git commit -m "Add blog post"
    Dev->>Git: git push origin main

    Note over Git,GH: CI/CD Pipeline Starts

    Git->>GH: Push to main branch
    GH->>Actions: Trigger workflow

    Actions->>Actions: Checkout code
    Actions->>Actions: Setup Node.js 22
    Actions->>Actions: Setup pnpm@9
    Actions->>Actions: pnpm install --frozen-lockfile
    Actions->>Actions: pnpm build

    alt Build Successful
        Actions->>Firebase: Deploy to hosting
        Firebase-->>Actions: Deployment successful
        Actions-->>GH: ✅ Build passed
        GH-->>Dev: Email notification
    else Build Failed
        Actions-->>GH: ❌ Build failed
        GH-->>Dev: Email notification with errors
        Dev->>Dev: Fix issues locally
    end

    Note over Firebase: Live at nilushansilva.info
```
This sequence diagram shows the complete workflow from creating a blog post to deployment, capturing user interactions, system processes, and conditional logic.
2. Flowcharts
Flowcharts are ideal for showing decision trees and process flows. Here’s how the portfolio site decides which theme to apply:
Theme Selection Logic
Rendered Diagram:
flowchart TD
    Start([User visits site]) --> CheckStorage{localStorage
theme exists?}

    CheckStorage -->|Yes| LoadTheme[Load saved theme]
    CheckStorage -->|No| CheckPreference{Check system
preference}

    CheckPreference -->|Dark mode| SetDark[Set dark theme]
    CheckPreference -->|Light mode| SetLight[Set light theme]
    CheckPreference -->|No preference| SetDefault[Set default theme]

    LoadTheme --> ValidateTheme{Is theme
valid?}
    ValidateTheme -->|Yes| ApplyTheme[Apply theme to HTML]
    ValidateTheme -->|No| SetDefault

    SetDark --> ApplyTheme
    SetLight --> ApplyTheme
    SetDefault --> ApplyTheme

    ApplyTheme --> SaveToStorage[Save to localStorage]
    SaveToStorage --> DispatchEvent[Dispatch theme-changed event]
    DispatchEvent --> End([Render page])

    style Start fill:#4ade80
    style End fill:#60a5fa
    style ApplyTheme fill:#f472b6
View Mermaid Code
```mermaid
flowchart TD
    Start([User visits site]) --> CheckStorage{localStorage<br/>theme exists?}

    CheckStorage -->|Yes| LoadTheme[Load saved theme]
    CheckStorage -->|No| CheckPreference{Check system<br/>preference}

    CheckPreference -->|Dark mode| SetDark[Set dark theme]
    CheckPreference -->|Light mode| SetLight[Set light theme]
    CheckPreference -->|No preference| SetDefault[Set default theme]

    LoadTheme --> ValidateTheme{Is theme<br/>valid?}
    ValidateTheme -->|Yes| ApplyTheme[Apply theme to HTML]
    ValidateTheme -->|No| SetDefault

    SetDark --> ApplyTheme
    SetLight --> ApplyTheme
    SetDefault --> ApplyTheme

    ApplyTheme --> SaveToStorage[Save to localStorage]
    SaveToStorage --> DispatchEvent[Dispatch theme-changed event]
    DispatchEvent --> End([Render page])

    style Start fill:#4ade80
    style End fill:#60a5fa
    style ApplyTheme fill:#f472b6
```
3. Class Diagrams
Class diagrams show object-oriented structure. Here’s the type system for the portfolio data:
Portfolio Type System
Rendered Diagram:
classDiagram
    class PortfolioData {
        +PersonalInfo personal
        +Skills skills
        +SkillCategory[] skillCategories
        +Experience[] experience
        +Education education
        +Interest[] interests
    }

    class PersonalInfo {
        +string name
        +string title
        +string tagline
        +string email
        +string phone
        +string location
        +SocialLinks social
        +string heroSummary
        +string[] summary
        +number yearsExperience
    }

    class SocialLinks {
        +string github
        +string linkedin
        +string? twitter
        +string? website
    }

    class SkillCategory {
        +string title
        +string icon
        +string color
        +string? description
        +string[] skills
    }

    class Experience {
        +string id
        +string title
        +string company
        +string location
        +string period
        +string type
        +string description
        +Highlight[] highlights
        +string[] technologies
    }

    class Highlight {
        +string title
        +string description
    }

    PortfolioData *-- PersonalInfo
    PortfolioData *-- SkillCategory
    PortfolioData *-- Experience
    PersonalInfo *-- SocialLinks
    Experience *-- Highlight
View Mermaid Code
```mermaid
classDiagram
    class PortfolioData {
        +PersonalInfo personal
        +Skills skills
        +SkillCategory[] skillCategories
        +Experience[] experience
        +Education education
        +Interest[] interests
    }

    class PersonalInfo {
        +string name
        +string title
        +string tagline
        +string email
        +string phone
        +string location
        +SocialLinks social
        +string heroSummary
        +string[] summary
        +number yearsExperience
    }

    class SocialLinks {
        +string github
        +string linkedin
        +string? twitter
        +string? website
    }

    class SkillCategory {
        +string title
        +string icon
        +string color
        +string? description
        +string[] skills
    }

    class Experience {
        +string id
        +string title
        +string company
        +string location
        +string period
        +string type
        +string description
        +Highlight[] highlights
        +string[] technologies
    }

    class Highlight {
        +string title
        +string description
    }

    PortfolioData *-- PersonalInfo
    PortfolioData *-- SkillCategory
    PortfolioData *-- Experience
    PersonalInfo *-- SocialLinks
    Experience *-- Highlight
```
This shows the complete type hierarchy of the portfolio data structure, including composition relationships and property types.
4. Component Diagrams
Component diagrams visualize system architecture. Here’s the Astro portfolio architecture:
Astro Portfolio Architecture
Rendered Diagram:
graph TB
    subgraph "Client Browser"
        HTML[HTML Pages]
        CSS[Tailwind CSS]
        JS[Client JS]
        React[React Islands]
    end

    subgraph "Build Time"
        Pages[Pages/*.astro]
        Components[Components/*.astro]
        ReactComp[React Components]
        Content[Content Collections]
    end

    subgraph "Styling"
        TW[Tailwind v4]
        DaisyUI[DaisyUI Themes]
    end

    subgraph "Deployment"
        Build[Astro Build]
        Firebase[Firebase Hosting]
    end

    Pages --> Components
    Pages --> Content
    Components --> ReactComp
    Pages --> TW
    Components --> DaisyUI
    Build --> Pages
    Build --> Firebase
    Firebase --> HTML
    ReactComp -.->|Hydrated| React

    style Build fill:#fbbf24
    style Firebase fill:#f87171
    style React fill:#60a5fa
View Mermaid Code
```mermaid
graph TB
    subgraph "Client Browser"
        HTML[HTML Pages]
        CSS[Tailwind CSS]
        JS[Client JS]
        React[React Islands]
    end

    subgraph "Build Time"
        Pages[Pages/*.astro]
        Components[Components/*.astro]
        ReactComp[React Components]
        Content[Content Collections]
    end

    subgraph "Styling"
        TW[Tailwind v4]
        DaisyUI[DaisyUI Themes]
    end

    subgraph "Deployment"
        Build[Astro Build]
        Firebase[Firebase Hosting]
    end

    Pages --> Components
    Pages --> Content
    Components --> ReactComp
    Pages --> TW
    Components --> DaisyUI
    Build --> Pages
    Build --> Firebase
    Firebase --> HTML
    ReactComp -.->|Hydrated| React

    style Build fill:#fbbf24
    style Firebase fill:#f87171
    style React fill:#60a5fa
```
5. State Diagrams
State diagrams model state transitions. Here’s the project status lifecycle:
Project Status Lifecycle
Rendered Diagram:
stateDiagram-v2
    [*] --> Planned: New project idea

    Planned --> InProgress: Start development
    Planned --> OnHold: Deprioritized
    Planned --> Cancelled: Scope changed

    InProgress --> Testing: Feature complete
    InProgress --> OnHold: Blocked
    InProgress --> Cancelled: Requirements changed

    OnHold --> InProgress: Unblocked
    OnHold --> Cancelled: No longer viable

    Testing --> InProgress: Issues found
    Testing --> Completed: All tests pass

    Completed --> Deployed: Production release
    Deployed --> Maintenance: Post-launch
    Maintenance --> Deployed: Updates deployed

    Cancelled --> [*]
    Deployed --> [*]: Project sunset

    note right of InProgress
        Active development
        Daily commits
    end note
View Mermaid Code
```mermaid
stateDiagram-v2
    [*] --> Planned: New project idea

    Planned --> InProgress: Start development
    Planned --> OnHold: Deprioritized
    Planned --> Cancelled: Scope changed

    InProgress --> Testing: Feature complete
    InProgress --> OnHold: Blocked
    InProgress --> Cancelled: Requirements changed

    OnHold --> InProgress: Unblocked
    OnHold --> Cancelled: No longer viable

    Testing --> InProgress: Issues found
    Testing --> Completed: All tests pass

    Completed --> Deployed: Production release
    Deployed --> Maintenance: Post-launch
    Maintenance --> Deployed: Updates deployed

    Cancelled --> [*]
    Deployed --> [*]: Project sunset

    note right of InProgress
        Active development
        Daily commits
    end note
```
6. Entity Relationship Diagrams
ER diagrams are perfect for database schema visualization:
Database Schema for Blog/Portfolio
Rendered Diagram:
erDiagram
    USER ||--o{ BLOG_POST : writes
    USER ||--o{ PROJECT : creates
    BLOG_POST }o--o{ TAG : tagged_with
    BLOG_POST }o--|| CATEGORY : belongs_to
    PROJECT }o--o{ TECHNOLOGY : uses

    USER {
        string id PK
        string name
        string email
        string avatar
        datetime created_at
    }

    BLOG_POST {
        string id PK
        string user_id FK
        string title
        string slug UK
        text content
        string category_id FK
        boolean featured
        datetime publish_date
    }

    PROJECT {
        string id PK
        string user_id FK
        string title
        text description
        string period
        string status
    }

    TAG {
        string id PK
        string name UK
    }

    CATEGORY {
        string id PK
        string name UK
    }

    TECHNOLOGY {
        string id PK
        string name UK
        string icon
    }
View Mermaid Code
```mermaid
erDiagram
    USER ||--o{ BLOG_POST : writes
    USER ||--o{ PROJECT : creates
    BLOG_POST }o--o{ TAG : tagged_with
    BLOG_POST }o--|| CATEGORY : belongs_to
    PROJECT }o--o{ TECHNOLOGY : uses

    USER {
        string id PK
        string name
        string email
        string avatar
        datetime created_at
    }

    BLOG_POST {
        string id PK
        string user_id FK
        string title
        string slug UK
        text content
        string category_id FK
        boolean featured
        datetime publish_date
    }

    PROJECT {
        string id PK
        string user_id FK
        string title
        text description
        string period
        string status
    }

    TAG {
        string id PK
        string name UK
    }

    CATEGORY {
        string id PK
        string name UK
    }

    TECHNOLOGY {
        string id PK
        string name UK
        string icon
    }
```
7. Git Graphs
Visualize your Git branching strategy:
Git Branching Strategy
Rendered Diagram:
gitGraph
    commit id: "Initial commit"
    commit id: "Add Astro setup"
    commit id: "Add Tailwind & DaisyUI"

    branch develop
    checkout develop
    commit id: "Setup content collections"
    commit id: "Add blog schema"

    branch feature/mermaid-blog
    checkout feature/mermaid-blog
    commit id: "Create mermaid blog post"
    commit id: "Add diagrams"

    checkout develop
    merge feature/mermaid-blog
    commit id: "Test blog post"

    checkout main
    merge develop tag: "v1.2.0"

    checkout develop
    branch feature/improvements
    checkout feature/improvements
    commit id: "Fix dynamic classes"
    commit id: "Update color mapping"

    checkout develop
    merge feature/improvements

    checkout main
    merge develop tag: "v1.3.0"
View Mermaid Code
```mermaid
gitGraph
    commit id: "Initial commit"
    commit id: "Add Astro setup"
    commit id: "Add Tailwind & DaisyUI"

    branch develop
    checkout develop
    commit id: "Setup content collections"
    commit id: "Add blog schema"

    branch feature/mermaid-blog
    checkout feature/mermaid-blog
    commit id: "Create mermaid blog post"
    commit id: "Add diagrams"

    checkout develop
    merge feature/mermaid-blog
    commit id: "Test blog post"

    checkout main
    merge develop tag: "v1.2.0"

    checkout develop
    branch feature/improvements
    checkout feature/improvements
    commit id: "Fix dynamic classes"
    commit id: "Update color mapping"

    checkout develop
    merge feature/improvements

    checkout main
    merge develop tag: "v1.3.0"
```
8. Gantt Charts
Project timeline visualization:
Portfolio Development Timeline
Rendered Diagram:
gantt
    title Portfolio Development Timeline
    dateFormat YYYY-MM-DD
    section Planning
    Requirements gathering    :done, req, 2025-01-01, 7d
    Architecture design       :done, arch, after req, 5d

    section Development
    Setup Astro project       :done, setup, 2025-01-13, 2d
    Implement layouts         :done, layouts, after setup, 5d
    Build components          :done, comps, after layouts, 10d

    section Styling
    Tailwind integration      :done, tw, 2025-01-20, 3d
    DaisyUI themes            :done, daisy, after tw, 5d

    section Content
    Portfolio data            :done, data, 2025-02-01, 5d
    Blog posts               :active, blog, after data, 10d

    section Deployment
    GitHub Actions setup     :done, ci, 2025-02-10, 2d
    Firebase hosting         :done, deploy, after ci, 2d
View Mermaid Code
```mermaid
gantt
    title Portfolio Development Timeline
    dateFormat YYYY-MM-DD
    section Planning
    Requirements gathering    :done, req, 2025-01-01, 7d
    Architecture design       :done, arch, after req, 5d

    section Development
    Setup Astro project       :done, setup, 2025-01-13, 2d
    Implement layouts         :done, layouts, after setup, 5d
    Build components          :done, comps, after layouts, 10d

    section Styling
    Tailwind integration      :done, tw, 2025-01-20, 3d
    DaisyUI themes            :done, daisy, after tw, 5d

    section Content
    Portfolio data            :done, data, 2025-02-01, 5d
    Blog posts               :active, blog, after data, 10d

    section Deployment
    GitHub Actions setup     :done, ci, 2025-02-10, 2d
    Firebase hosting         :done, deploy, after ci, 2d
```
9. Pie Charts
For data visualization:
Technology Stack Distribution
Rendered Diagram:
pie title Technology Stack Distribution
    "TypeScript/JavaScript" : 40
    "React Components" : 15
    "Astro Components" : 25
    "CSS/Tailwind" : 12
    "MDX Content" : 8
View Mermaid Code
```mermaid
pie title Technology Stack Distribution
    "TypeScript/JavaScript" : 40
    "React Components" : 15
    "Astro Components" : 25
    "CSS/Tailwind" : 12
    "MDX Content" : 8
```
10. Mindmaps
For brainstorming and concept mapping:
Portfolio Architecture Overview
Rendered Diagram:
mindmap
    root((Portfolio))
        Frontend
            Astro 5
            React 19
            Styling
                Tailwind v4
                DaisyUI
        Content
            Blog Posts
            Projects
            Portfolio Data
        Infrastructure
            GitHub
            Firebase
            Build Tools
        Features
            Multi-theme
            SEO
            Responsive
View Mermaid Code
```mermaid
mindmap
    root((Portfolio))
        Frontend
            Astro 5
            React 19
            Styling
                Tailwind v4
                DaisyUI
        Content
            Blog Posts
            Projects
            Portfolio Data
        Infrastructure
            GitHub
            Firebase
            Build Tools
        Features
            Multi-theme
            SEO
            Responsive
```
Best Practices for Mermaid Diagrams
1. Keep It Simple
Don’t try to show everything in one diagram. Break complex systems into multiple focused diagrams.
2. Use Consistent Styling
Apply custom styles to make diagrams more readable and match your brand.
3. Add Notes for Context
Notes help explain non-obvious aspects of your diagrams.
4. Version Control Your Diagrams
Since they’re text, they diff well and can be code-reviewed.
5. Use Subgraphs for Organization
Group related components together for clarity.
Integrating Mermaid in Your Projects
In Markdown (GitHub)
Just use code blocks with mermaid language - GitHub renders them automatically.
In Astro (like this blog)
Use code blocks with mermaid language identifier:
```mermaid
graph TD
    A[Start] --> B[End]
```
In Documentation Sites
Most modern documentation frameworks (Docusaurus, VuePress, Starlight) support Mermaid out of the box.
In VS Code
Install the “Markdown Preview Mermaid Support” extension for live preview.
Real-World Use Cases
1. API Documentation
Use sequence diagrams to show API request/response flows.
2. System Architecture
Component diagrams for microservices architecture.
3. User Flows
Flowcharts for UX documentation.
4. Database Design
ER diagrams for schema documentation.
5. Project Planning
Gantt charts for sprint planning.
6. State Management
State diagrams for Redux/Zustand flows.
Conclusion
Mermaid diagrams are an invaluable tool for software developers. They allow you to:
- Document as you code - No context switching to diagramming tools
- Review diagrams in PRs - See exactly what changed
- Keep docs in sync - Update diagrams with code changes
- Onboard faster - Visual documentation is easier to understand
- Communicate clearly - A diagram is worth a thousand lines of code
The best part? You can start using Mermaid today. Just add code blocks with the mermaid language identifier to your Markdown files!
Resources
- Mermaid Official Documentation
- Mermaid Live Editor - Test your diagrams online
- VS Code Extension
- GitHub Mermaid Support
Happy diagramming!
Have you used Mermaid in your projects? What’s your favorite diagram type? Let me know on GitHub!